

Paper Trails
Automating FINRA Financial Reporting with Power Platform


While You Were Lunching
Continuing our work on custom connectors, I’ve developed a custom connector for FINRA, a financial markets regulatory agency that’s part of the SEC.
FINRA protects US investors under the SEC's oversight from Congress, ensuring the OTC securities industry operates properly. This enables investors of all sizes to engage in the market with consumer protection.
While the SEC connector highlights financial statements and filings, FINRA offers data that’s centered on securities transactions, registration, licensure, and products, along with continuing education. Their free API endpoint also offers access to OTC market summaries and transaction details, so the range of offerings can help streamline administrative tasks that often consume up to a data analyst’s or administrator’s time.
If you’re spending time pulling market data from FINRA for reports, this connector may help you reduce manual work with pre-prepared views ready for import. Stick to the important stuff without all the wrangling.
The custom connector acts as a gateway to the FINRA information service, delivering data from the Query API and reducing the manual work involved just to get simple market summaries.
Currently, the connector includes three actions to run each Equity summary. The scope is small but the offerings are relevant and can easily be expanded.
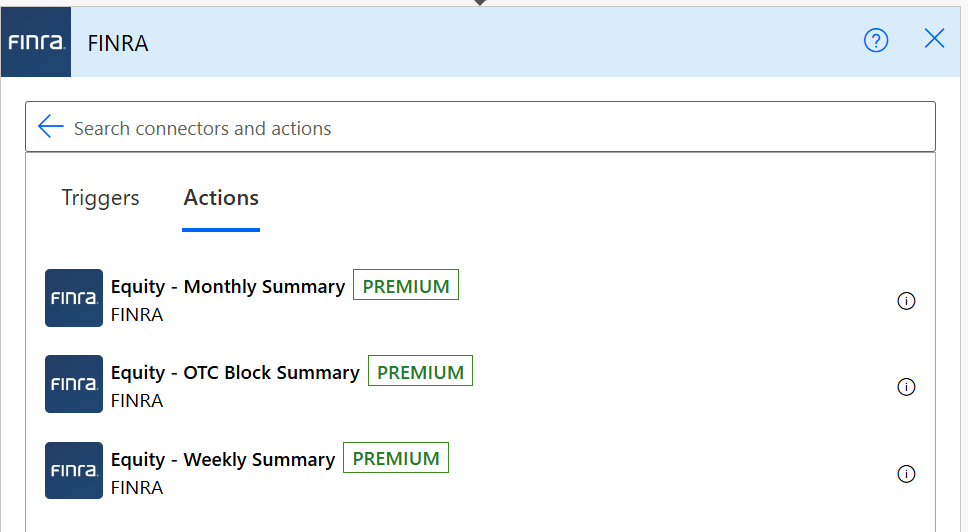
The next release will feature all other Equity endpoints:
PLUS: Equity endpoint metadata
The free Fixed Income endpoints will also be implemented, and that means more efficiency for your financial operation.
Caveats
Some things to know before you go.
Scope. Only free endpoints for Equity. More to be added later.
OAuth. Use OAuth to authenticate and make requests. After you create a client/app and a secret in the FINRA API Console, use the app id and secret when connecting to endpoints.
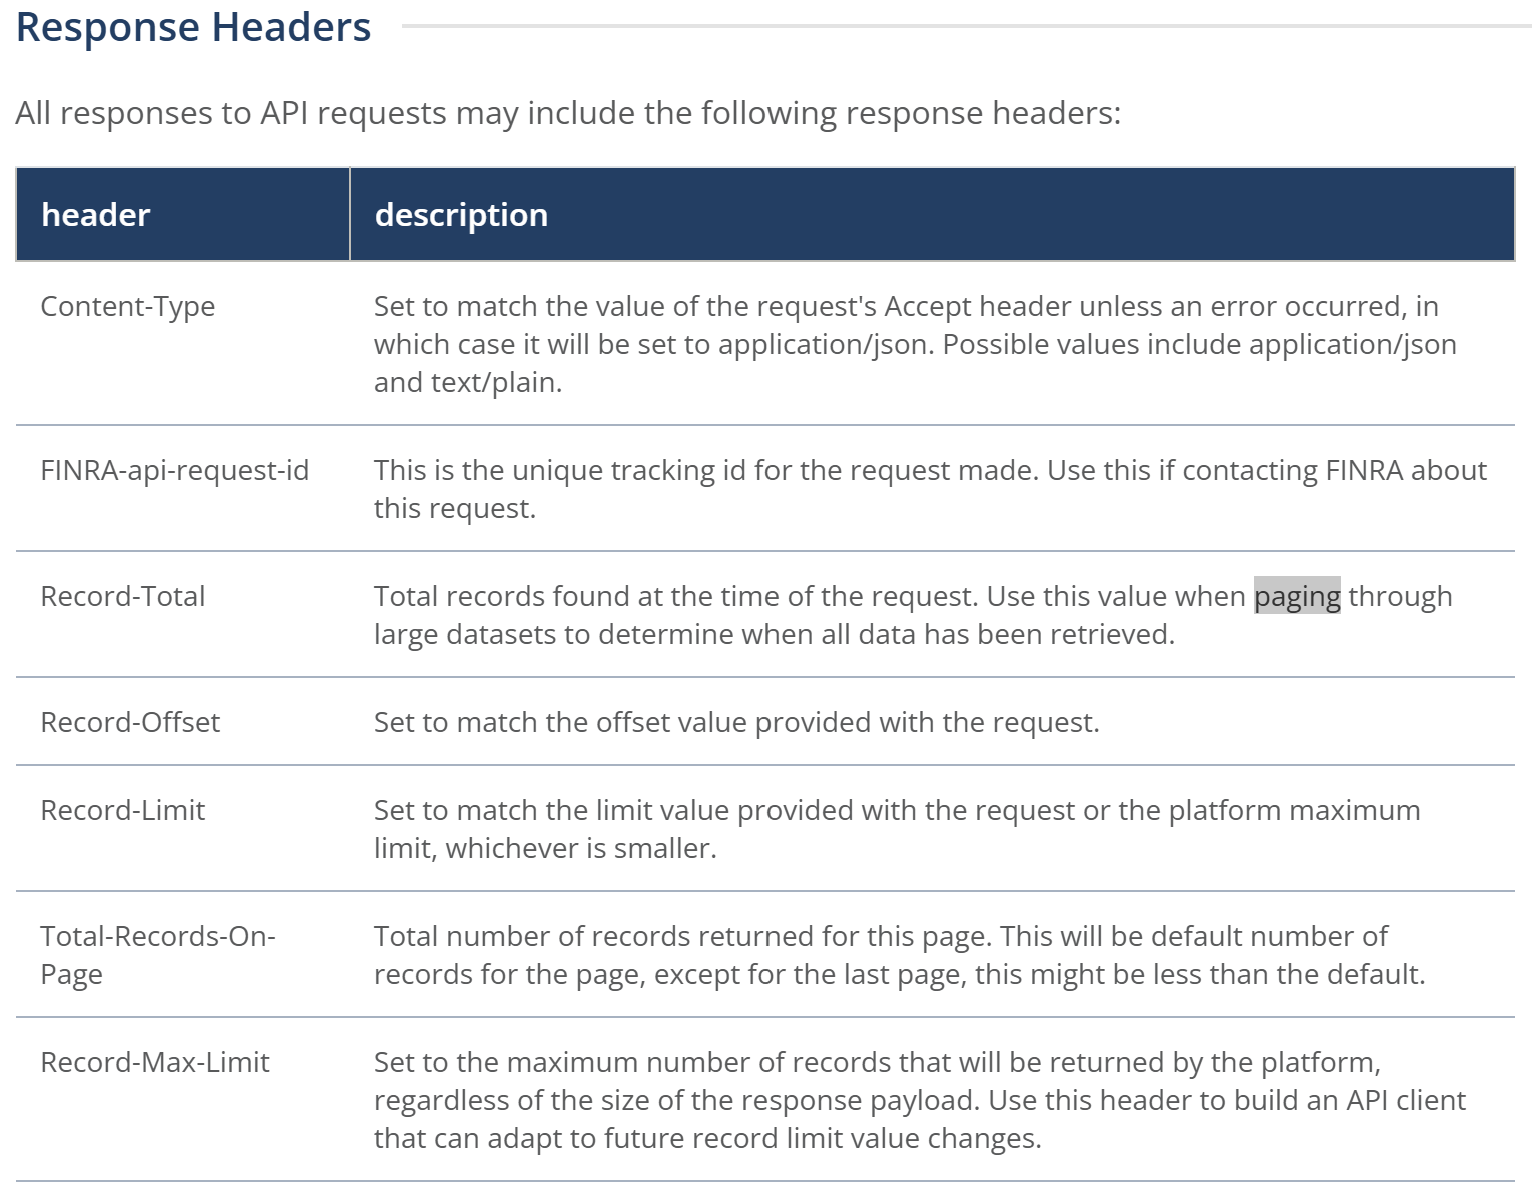
Paging. Be sure to page through large result sets. Use the response headers
Record-Total,Record-OffsetandTotal-Records-On-Pageto page through all records returned.
Not so bad.
Power BI Example: Equity Monthly Summary
I don’t know much about equity, but I did put together a sample report to demonstrate the type of visuals that can be generated from market summary data.
This is test data using the Monthly Summary endpoint.
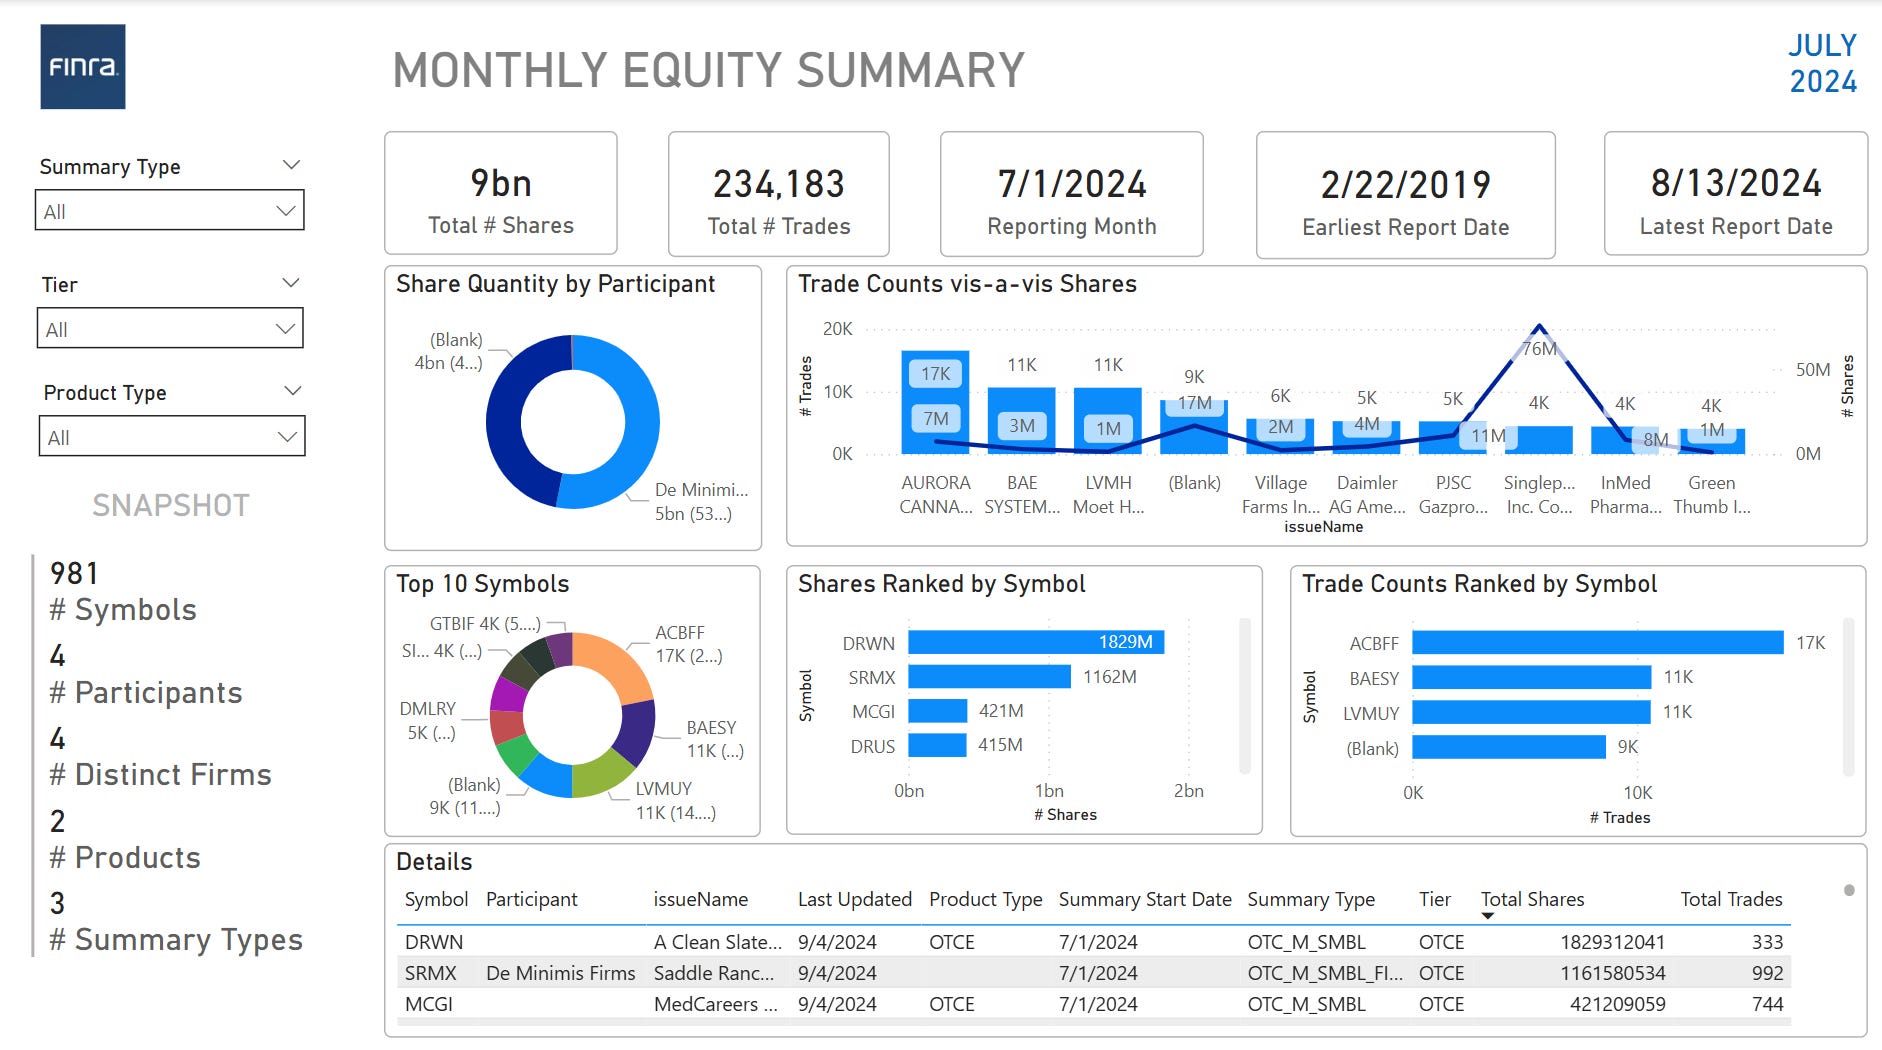
A nice snapshot and the Details table can be exported to Excel. Less wrangling, more analysis.
/**/